Application Monitoring and Scaling
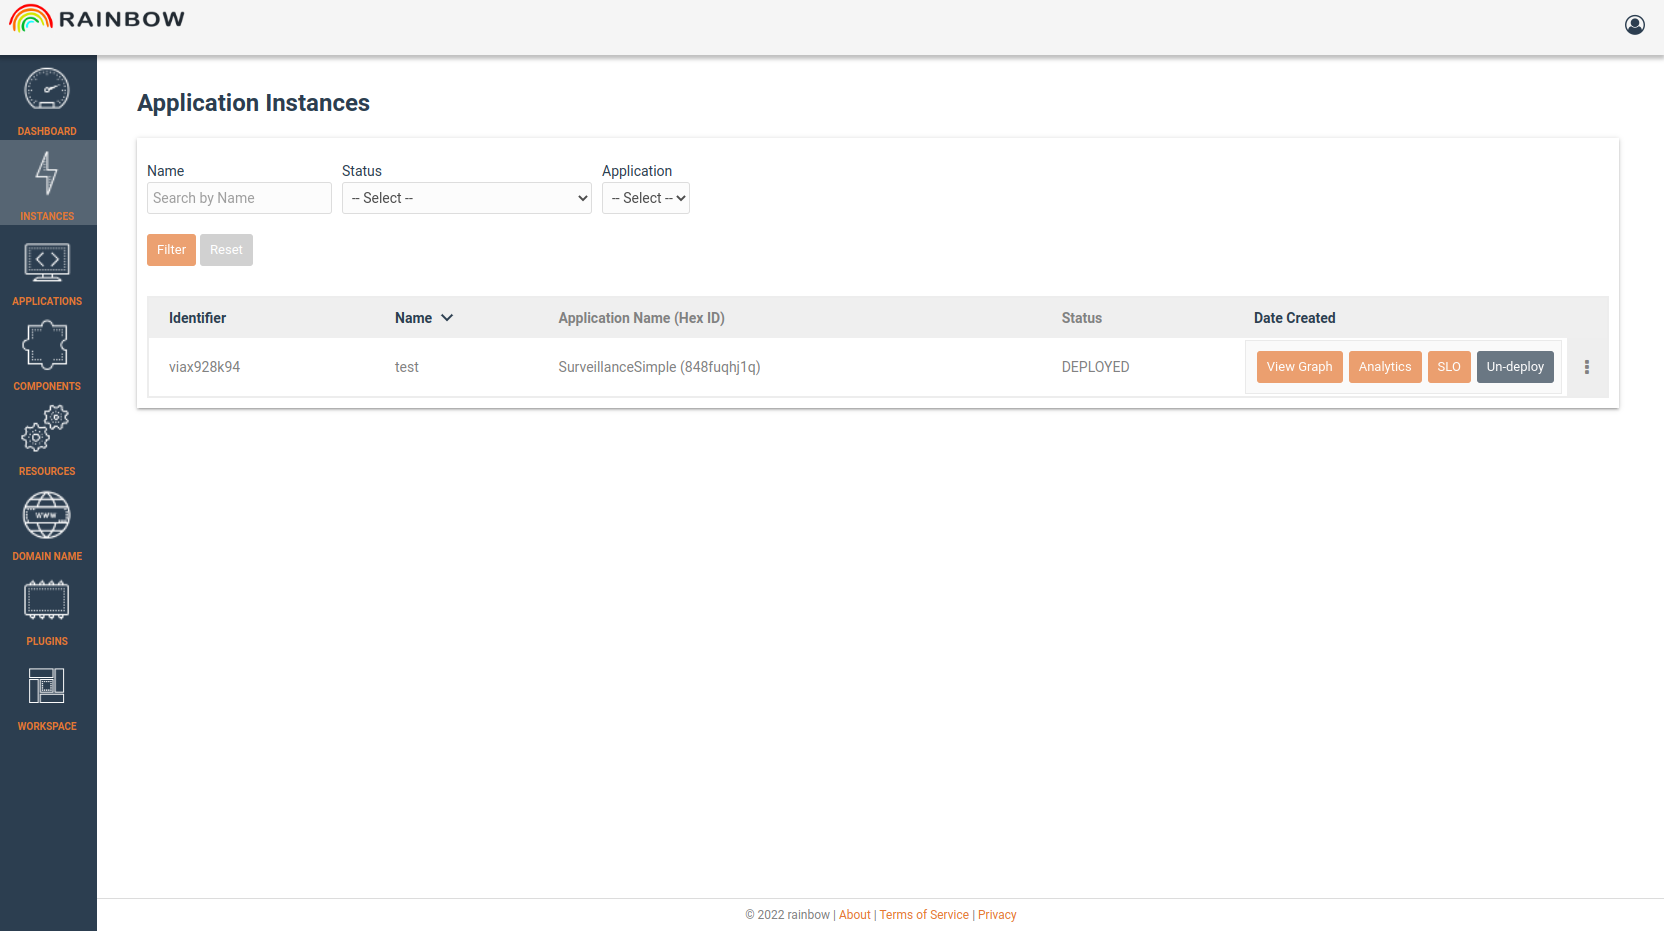
Monitoring Applications instances
Monitoring metrics are presented for each one of the application nodes
Application Elasticity
From the application instance list, the user must select the “Elasticity Policies” option for the deployed application, in order to configure how the application scales.
By selecting the appropriate function, user can to aggregate the monitoring results in various ways.
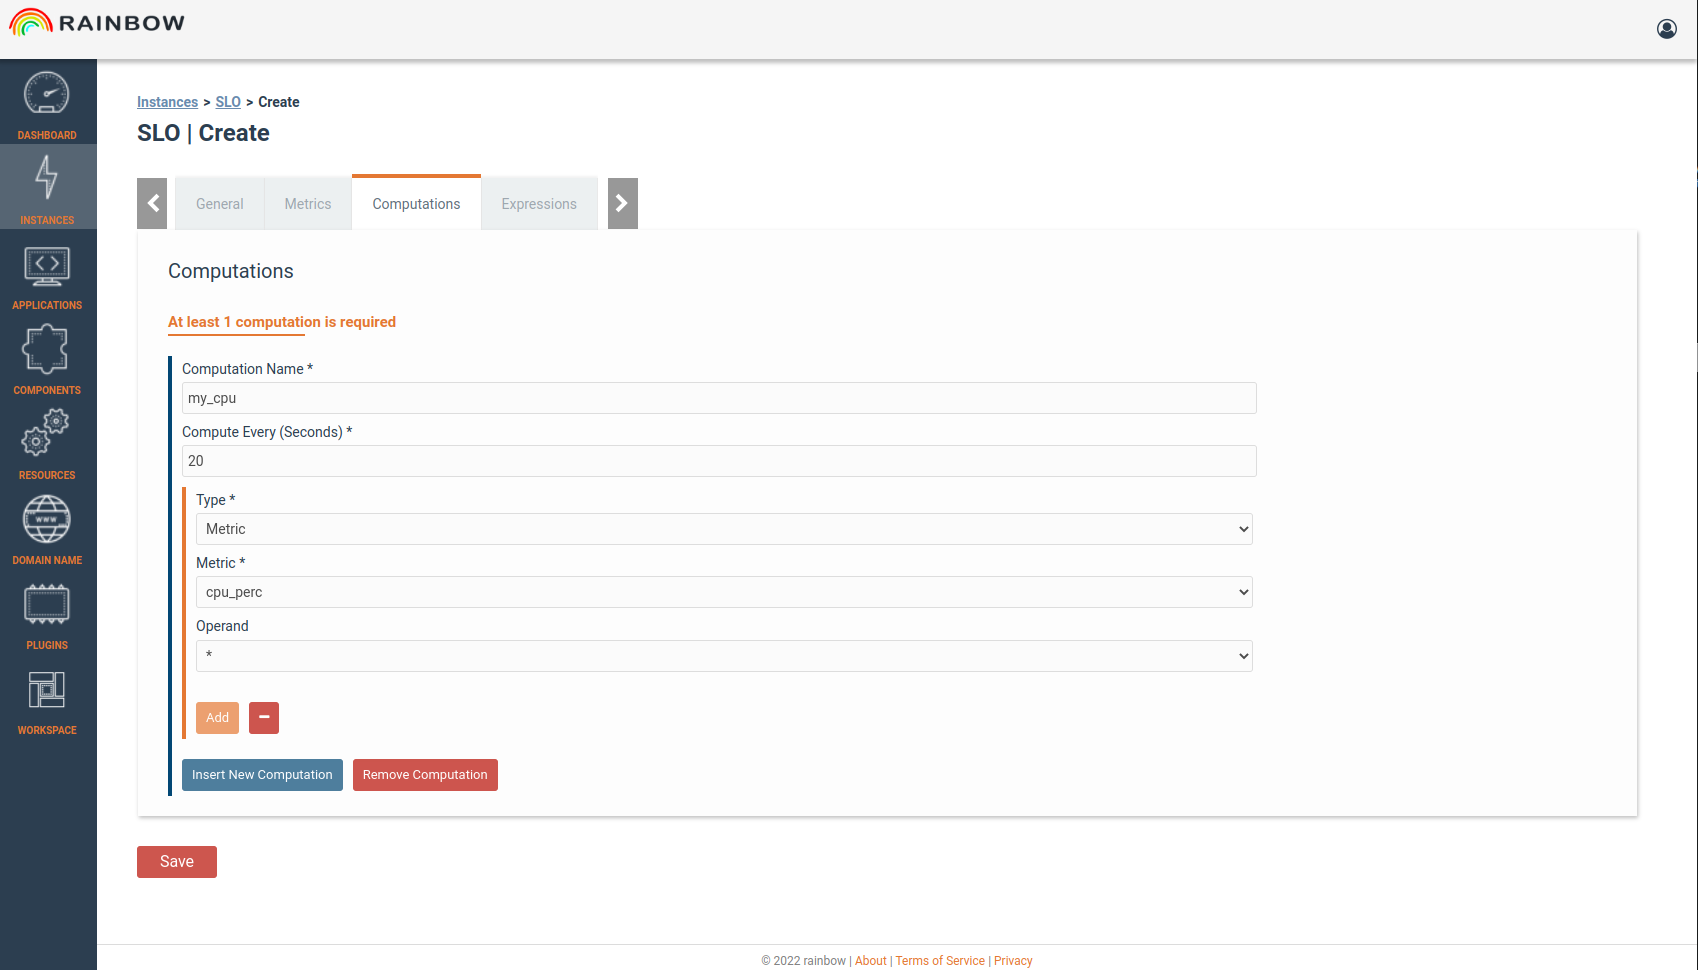
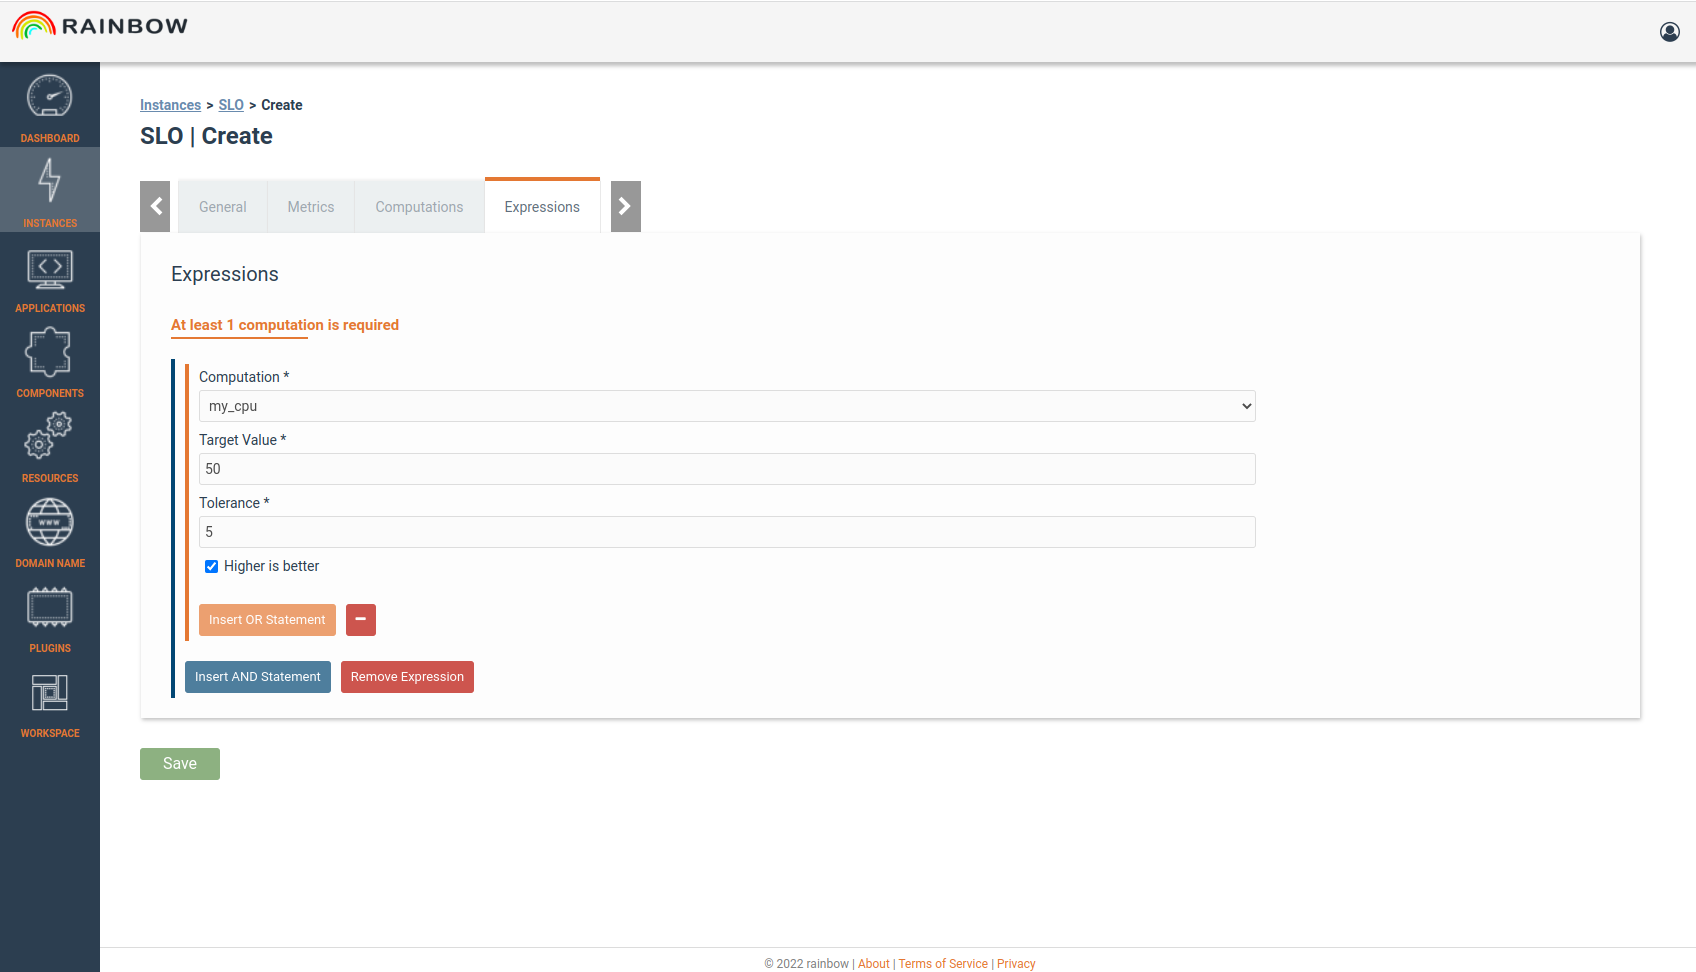
For the monitored parameter we select the metric and it’s dimension from appropriate lists.
An operand shall be added to the policy and the threshold that the policy shall confirm to.
The period field is used to set the size of the time window that the metric values are collected and aggregated for the policy enforcement.
- On the scaling action we can select the component to scale in or scale out, and the number of workers to scale.
After a scaling action is performed, some time is needed for having the component workers deployed. For this reason we should ensure that for this period we don’t fire additional scaling actions.
This is done through the “Inertia” field that is used to define the time in minutes that after a scaling action is done,no further action is performed.
Multiple scaling actions can be added.
The policy can be saved and will be enforced to the application within few seconds.
In this example we had initially only one worker of the WordPress component.
- But due to the scaling rule, an additional node has been created.
A load balancer had been already deployed from the initial deployment since we had defined that this component might need multiple workers.
The scaling action is visible to the user through the logs and the number on workers in the “WordPress” node in the graphs.